One of the drawbacks to using Ruby or Ruby on Rails in the inability to debug your code from within an integrated development environment, or IDE. For someone that is used to debugging in this way, Ruby feels like a large step back in their productivity.
My personal IDE of choice is VS Code. It’s a free IDE that was spun off of the Microsoft Visual Studio suite of tools and has really become one of the best free IDEs available today. Like many IDEs, VS Code has the ability to extend it’s core functionality using a catalog of extensions. I recently came across an extension that mentioned being able to use VS Code’s debugger with Ruby, so I dug in to figure it out.
Step 1: Add the Ruby extension to VS Code. The extension itself is a must have for developing any Ruby, but the main feature I’m talking about today is getting your debugger up and going. Make sure you spend a couple of minutes and read the README. There is too much good stuff for me to over in this post.
Step 2: Install debug GEMS. For the purpose of this post, I’m going to be adding to my local gem repository, but feel free to add them to your project if that works better for you. The specifics vary a bit based on the version of Ruby you are using. I’ve shown Ruby 2.x instructions below, but you can find instructions for older versions of ruby here.
Ruby 2.x
gem install ruby-debug-ide
gem install debase
Note: For Ruby 2.5 or greater, make sure you are using debase version 0.2.2 or greater to make sure all features of the debugger are supported.
ruby-debug-ide is the same gem that other paid IDEs like RubyMine use to enable their debugger.
Step 3: Setup a new debugger inside VS Code. This seems harder than it really is the first time you do it. Luckily, this should be one of those “set it and forget it” things.
I prefer to tie it into my user profile rather than include it in my project. That way I can customize everything the way I would like without effecting my teammates or project collaborators.
Open VS Code Settings. There are multiple ways to do this. Any of them should work.
On Windows/Linux – File > Preferences > Settings
On macOS – Code > Preferences > Settings
From the Command Palette (⇧⌘P) with Preferences: Open Settings
Use the keyboard shortcut (⌘,)
Search for Launch. You will see a description of the feature and a link to Edit in settings.json. Click that link.
The location of your launch configuration doesn’t matter, but I prefer to have it at the top of my settings.json. This is how mine looks.
// Place your settings in this file to overwrite the default settings
{
  "launch": {
    "version": "0.2.0",
    "configurations": [{
      "name": "Rails server",
      "type": "Ruby",
      "request": "launch",
      "cwd": "${workspaceRoot}",
      "program": "${workspaceRoot}/bin/rails",
      "pathToRDebugIDE": "~/.asdf/shims/rdebug-ide",
      "showDebuggerOutput": true,
      "args": [
        "server"
      ]
    }]
  },
  ...
Note: You can also add this same configuration to your projects launch.json file by going to the debugger and clicking the gear icon. The same configurations will work in either place.
The line that really tripped me up was the “pathToRDebugIDE” setting. Without this line, nothing actually seemed to work, but there was also no indication that I was missing somethting. Obviously the actual contents of this value will change with your setup. I got mine by going into my main project and running which rdebug-ide.
Step 4: Start the server. Open the debug sidebar (It looks like a bug crossed out). Make sure that the Rails server configuration is selected, and hit the green button. This will launch the debug console pane and start the server inside a debugger.
Once the server is up and running, verify your Rails app is working normally.
If everything looks good. Go ahead and add a breakpoint in VS Code. You do this by hovering your mouse to the left of the line numbers until you see a dark red dot. When you are on the line you want to debug, click the dot. It will then become a more bright red dot and persist after you move the mouse away.
Note: You can also add breakpoints using the standard keyboard shortcut F9.
Go to a page in your Rails app that will hit the code where you just added the breakpoint. You should be forced away from your browser and back into VS Code.
You are now in debug mode paused right before the line you selected executes.
On the debug pane, you can dive in and see the attribute values stored in memory.
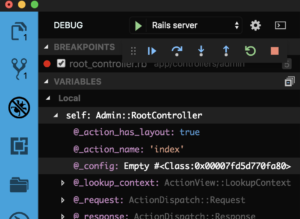
You can also interact with all the variables like you would in rails console by using the input box in the debug console.
Step 5: Rejoice! You just reclaimed control over the way you debug your code.
Hopefully this guide helped you get better at debugging your code. I’d love to know if you struggled, or have any improvements to my process. My Twitter handle is @andyvisme.
Do you use breakpoints wile using rspec? I also use asdf but having problems. Maybe a future blog post.